One browser tab shows
all of your Spark computers.
The dashboard shows the GPU, the unified memory, the temperatures, and the tokens for each second on every DGX Spark node. The run planner calculates the memory for a full vLLM recipe. Then it starts that recipe on the node.
What it shows
Each node has a card and a page.
The metrics come to your browser on a WebSocket, and the server keeps the history. If you refresh the page, the chart continues. If a second person opens the same page, that person sees the same chart.
GPU
The GPU load, the clocks, and the processes
The panel shows the temperature, the power, and the SM clock. It also shows each process that holds GPU memory. The SM share for each process comes from nvidia-smi pmon.
SM status
Why the SMs are at that speed
The panel shows the SM clock and its maximum value. It decodes the NVML clock events: the power limit, the temperature limit, and the hardware slowdown. It also shows the number of degrees before the driver decreases the clock.
Unified memory
The CPU and the GPU share one pool
On the GB10, the CPU and the GPU use one LPDDR5X memory pool. The dashboard gives this memory its correct name. It does not show a separate VRAM value, because the driver does not report one.
Inference
Decode and prefill have different charts
The dashboard identifies vLLM, llama.cpp, SGLang, TGI, and Ollama from their own replies. Decode gives tens of tokens each second. A prefill burst gives thousands of tokens. If they share one axis, the decode data becomes too small to read.
CPU, storage, network
Data for each core, mount, and interface
The server calculates each rate from the difference between two polls. Sometimes a counter goes back to zero, because a host or a model server started again. The rate then shows zero, and not a large incorrect value.
Temperatures and power
Every temperature zone from the kernel
The dashboard also has the three commands that write and do not read: reboot, shutdown, and Wake-on-LAN. You must give the node its MAC address before Wake-on-LAN operates. The dashboard refuses to shut down its own host, because this stops the dashboard.
Containers
Start, stop, and restart
The list shows each container from docker ps -a. After a command, the server polls the node again. The row then shows the true state. If a container does not start, the row shows this.
HuggingFace cache
Each model and dataset, largest first
On a Spark, this cache is usually the largest data on the disk. It was 588 GB in 28 repositories on the test machine. A download continues on the node after you close the page. Before you delete a repository, the panel shows the correct space from hf cache rm --dry-run.
The whole fleet
Ten tabs cost the same as one tab
The server polls the nodes, and the browsers only subscribe. Each node has its own timer. Thus a slow host becomes late alone, and it does not delay the other nodes.
Screens
Demo mode makes all of these screens.
Demo mode gives synthetic metrics for three example nodes. This is why the nodes have the names spark-demo-01, spark-demo-02, and workstation. Two commands start the same dashboard on your computer, and you do not need a GPU.
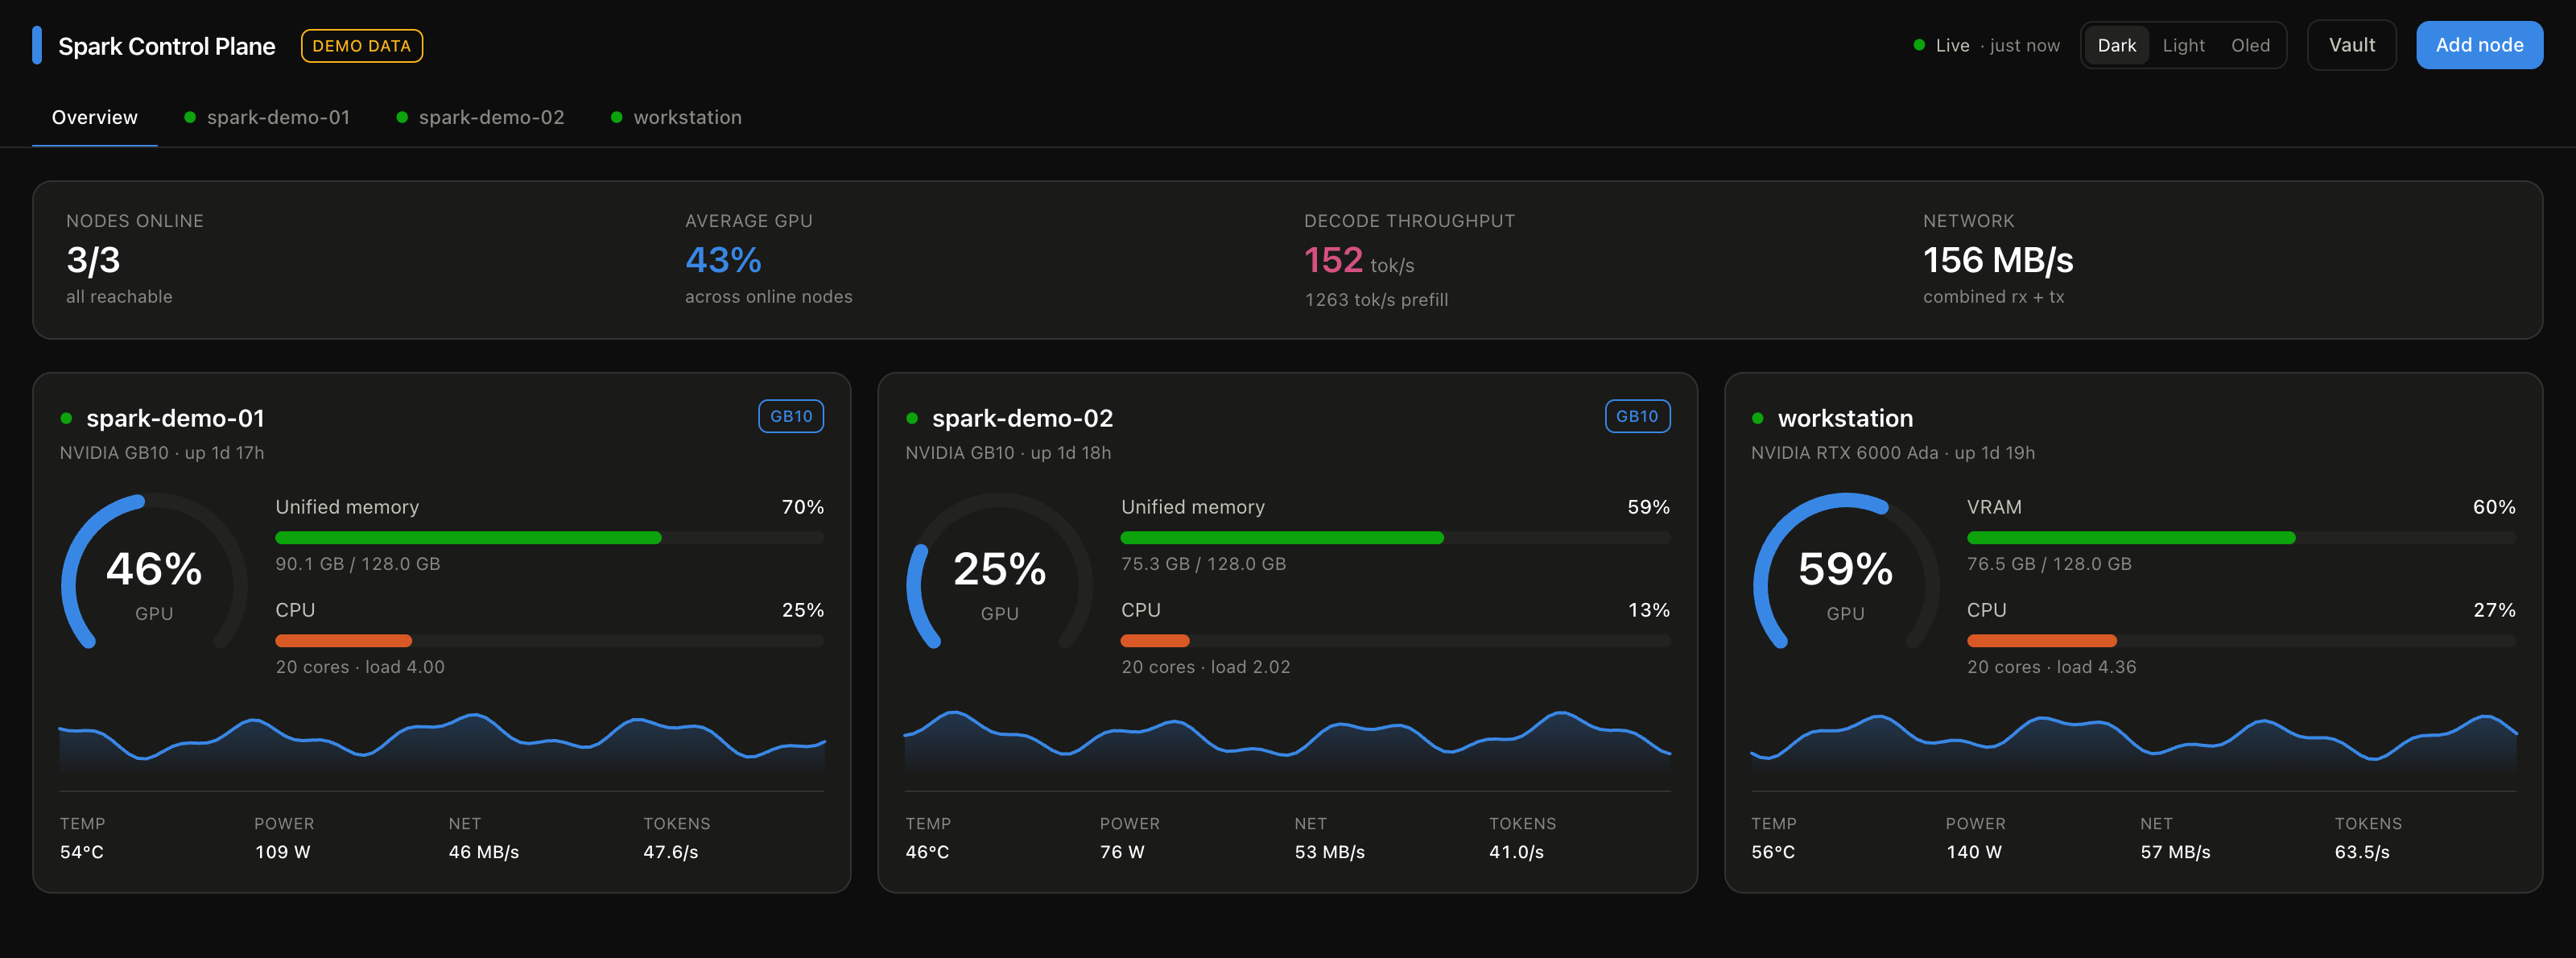
The top strip adds the values from each node that is online. Below it, each node has one card: a GPU dial, the unified memory, the CPU, a chart of the last ten minutes, and four values.overview.png · dark theme
Model runs
The catalog has complete recipes.
A recipe gives its weights, its image, and each vLLM flag. Select a recipe that fits. Set the context length and the number of concurrent requests. The node then downloads the weights, pulls the image, and starts the container. It waits until the endpoint replies.
The settings are related to each other. DFlash2 needs a target model with an unquantized lm_head. GDN layers operate in only one mamba cache mode. FP8 KV needs calibration scales, and only some exports have them. With independent fields, it is easy to select a combination that fails some minutes after the weight load starts.
- Weights — the node downloads them to its HuggingFace cache and shows the bytes
- Image — the node pulls it, or builds it when the recipe needs more wheels
- Container — the node starts it on the port from the recipe, or on your port
- Loading — vLLM reads the weights into memory and makes the CUDA graphs
- Serving — the endpoint replied to a real request; the server then examines docker ps at each poll
The run continues on the node. It does not stop if you close the page, start the dashboard again, or lose the SSH connection.
- id: qwen38-27b-nvfp4-dflash2
  name: Qwen3.8-27B · NVFP4 + DFlash2
  model:
    repo: RadixArk/Qwen3.8-27B-NVFP4-BF16-LMHead
    sizeGB: 23.8
    measured: true        # false, and the panel says "estimate"
  image:
    ref: vllm/vllm-openai:v0.28.0-aarch64
  port: 8000
  overheadGB: 8.2         # non-torch + activation + graphs
  kvBytesPerToken: 44827  # gives the pool its size
  args:
    --max-model-len: 262144
    --kv-cache-dtype: fp8
The server checks each recipe when it reads the file. It checks the ids, the image references, the container names, and each flag. If one recipe is bad, the server refuses the full catalog and gives the reason. The dashboard continues to show the node data.
Install
You install nothing on the nodes.
The server sends read-only commands on SSH: /proc, /sys, and nvidia-smi. It puts these commands in one script, thus each poll uses one connection. There is no agent and no configuration file to write. You do not restart the server after you add a node.
One command
The installer clones the repository into ~/.spark-control-plane, installs the dependencies, builds the interface, and puts a spark-control-plane command on your PATH. Nothing needs sudo. If /usr/local/bin is not writable, the command goes to ~/.local/bin, and if you do not have Node.js 20 or later, the installer fetches its own copy into the prefix instead of touching the system.
Start with no hardware
Demo mode gives synthetic metrics for three example nodes. This is sufficient to see all of the dashboard, and each screenshot on this page comes from it. You need no GPU and no Spark.
Then add your nodes
Open the dashboard and click Add node. Give the host, the SSH user, and the path to the key. Then click Test. It tells you if the connection operates, if nvidia-smi found a GPU, and if each inference port replied. Do this before you save the node.
$ /bin/bash -c "$(curl -fsSL https://raw.githubusercontent.com/garykww/spark-control-plane/main/install.sh)"Run this on the machine that will host the dashboard, not on the nodes. Re-run it to update: it fast-forwards the checkout, rebuilds, and leaves your configuration and any local edits alone. It offers to start on boot under systemd or launchd; --service accepts that without the prompt, and --no-service declines it.
$ spark-control-plane
# synthetic nodes, no hardware needed
$ DEMO_MODE=1 spark-control-plane
The server listens at 127.0.0.1:5555. Port and bind address live in ~/.spark-control-plane/spark-control-plane.env, which updates never overwrite; to reach it from your LAN, set SPARK_BIND_HOST=0.0.0.0 there or pass --bind to the installer.
$ docker compose up --build -dDocker mounts ./config for the node list. It mounts ~/.ssh read-only for your keys. The Spark uses arm64, thus you must build on the Spark or add --platform linux/arm64.
$ npm install
$ npm run build
$ npm start
The clone, if you would rather manage it yourself. DEMO_MODE=1 npm run dev gives the demo on the Vite dev server at localhost:5173, with a DEMO DATA badge in the header.
Limits
The data that the dashboard cannot get.
A dashboard must not show a value that it cannot measure. These are the values that this dashboard does not have.
There is no data for each SM
NVML and DCGM do not give data for each streaming multiprocessor. utilization.gpu is the fraction of the time when one kernel or more was on the GPU. It is an average for the full GPU. Only a profiler gives data for each SM, and a profiler attaches to one process. Thus the occupancy grid is a proportional view and not a hardware map. The panel gives this information on the screen.
Memory bandwidth is a specification
The dashboard shows 273 GB/s for the GB10 as a platform specification, and not as a measurement. To measure the true bandwidth, you need the DCGM profiling fields. DCGM is a different NVIDIA package, and this dashboard does not use it.
A dash means "not reported"
A dash does not mean zero. The driver does not report the fan speed on a GB10, because the GB10 has no fan. A model server without a /metrics endpoint is a second example. The dashboard shows its model list, but the counters show a dash. "Not reported" and "nothing occurred" are different.
The prompt total includes the cached tokens
vLLM does not process the cached blocks. Thus the prefill rate includes work that the GPU did not do. In one long agent workload with a warm prefix cache, 94% of the prompt tokens were cache hits. The server reported 12.99M prompt tokens, and 12.32M of them were free. This is why the panel shows the share next to the total.
Do not connect the dashboard to the internet. The API has no authentication. It assumes a trusted network, the same as the SSH keys that it uses. Control of the Docker daemon on a node is equal to root access on that machine. Put the dashboard behind Tailscale, a VPN, or a reverse proxy with authentication.
Open source
All of the code is in one repository.
The repository has an Express server with a poll loop and a React interface. The tests are pure functions, and they use recorded output from /proc and nvidia-smi. There are about 11,000 lines, and the MIT license applies to all of them. You do not need hardware to run the tests.